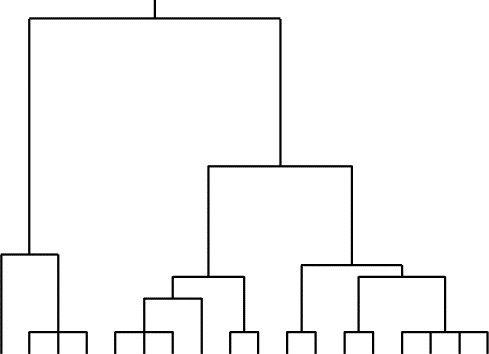

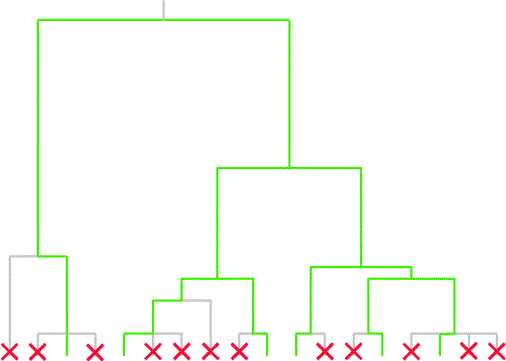
If we lose 80% of the population, much of the diversity
(evolutionary history) of the population is still preserved (green
shows the tree of the remaining population):
However, the remaining diversity is vulnerable. Deep branches
representing a lot of evolutionary history are now represented by only
a few individuals:
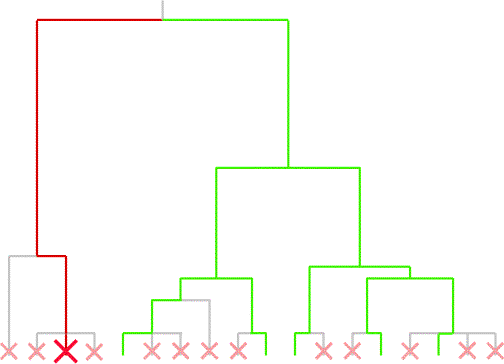
This means that much of the surviving diversity disappears within a
short time due to random fluctuations.
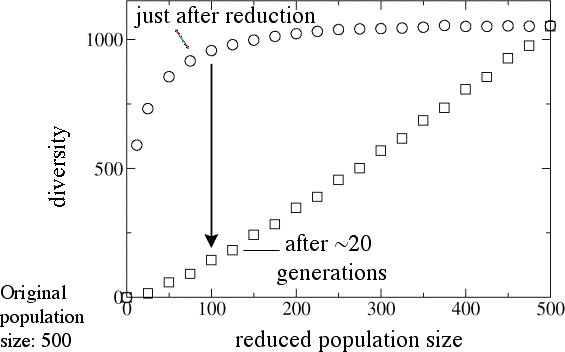
The vulnerability of residual small groups of related organisms can
be
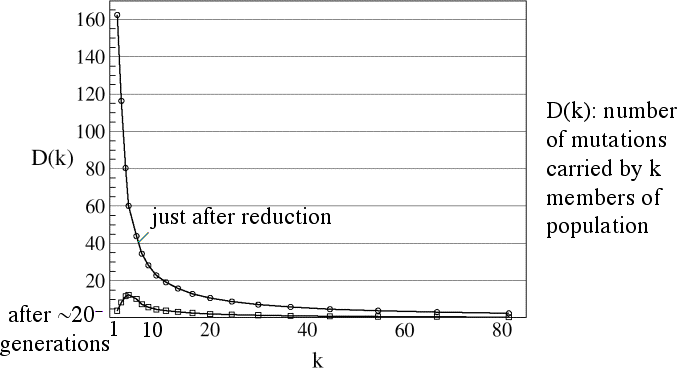
seen from a plot showing the number of mutations carried by exactly k individuals as a function of k. The area under this
curve is the total diversity. D(k) is shown just after the extinction
event (upper curve), and in
the long term. For the case shown, almost 25% of the total
diversity just after the extinction is found in only one or two
individuals, and most of the diversity lost is found in less than ten
individuals:
