We can compare this prediction with genetic data from field
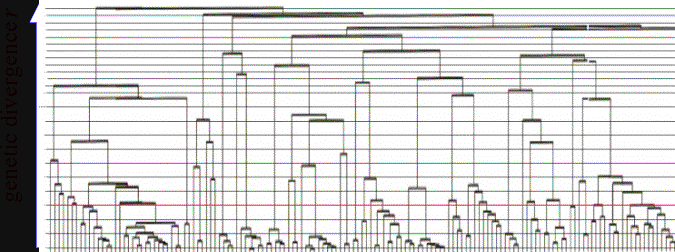
populations. This is part of the genealogical tree of a population of Pseudomonas soil bacteria (data
from Cho & Tiedje):

Since the Pseudomonas tree is
only a sample, we need to account for the effect of sampling on the
distribution. To do this, we simply simulate the ancestry of the
samples. We directly simulated the ancestral tree of the samples as a
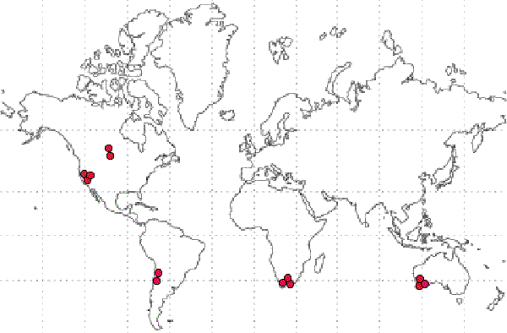
random walk, initializing the simulation by representing organisms at
the specific geographical locations where the Pseudomonas samples were obtained:

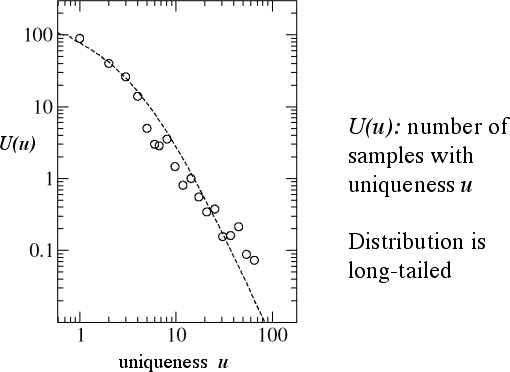
The circles represent the number of samples with a uniqueness of u, for the sampled Pseudomonas
population. The dashed line is an average over 1,000 spatial
simulations:
