 Files are
assumed to be registered in a common coordinate system, but if they
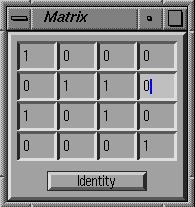
are not, they can be easily transformed at load time through a matrix into
a different coordinate system.
Files are
assumed to be registered in a common coordinate system, but if they
are not, they can be easily transformed at load time through a matrix into
a different coordinate system.
Files are loaded one at a time into the system. Each piece of data (points, segments, edgels and surfaces) is tagged with which file it came from. Files can also easily be deleted from the system.
Files are
assumed to be registered in a common coordinate system, but if they
are not, they can be easily transformed at load time through a matrix into
a different coordinate system.
This option is also convenient to
test the reconstruction options on data that is not axis-aligned
(currently, most of my sample input data is axis-aligned).
It is also useful in creating arbitrary building arrangements by
loading files through different matrixes into the same coordinate system.
![]()
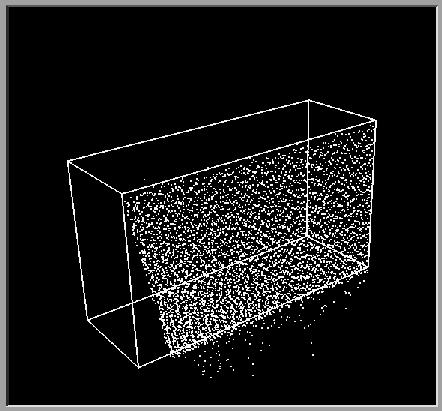
example of a point dataset aligned with a wireframe model of the scene and transformed through a matrix to be non-axis aligned
Because the datasets of points can be much too large to use all at once, they can be sampled by loading only every nth point. Also once a set of points is loaded, one can choose to display only every mth point.
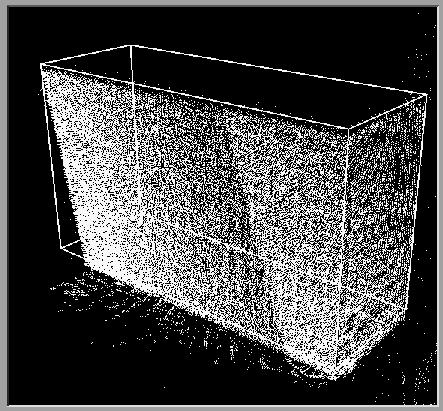
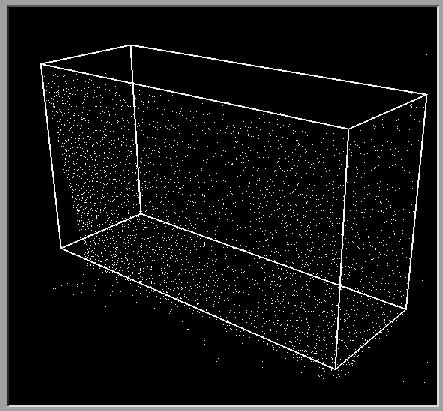
images of point data set under different sampling ratios
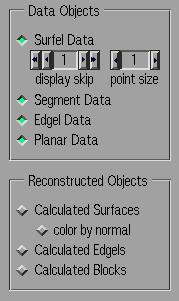 The data currently loaded into the system can be viewed selectively
by file, by data type and by bounding box.
The data currently loaded into the system can be viewed selectively
by file, by data type and by bounding box.
Calculated planes are by default highlighted in green, but can also be viewed colored by normal to visually indicate which of their neighbors they most nearly match in angle.
The tree structure can be displayed and "walked through", highlighting neighboring cells.