200 Technology Square, Room 434, Cambridge MA 02139
Erik M. Rauch![]() 1 and Mark M. Millonas
1 and Mark M. Millonas ![]()
![]() Computer Science and Artificial Intelligence Laboratory, Massachusetts Institute
of Technology,
Computer Science and Artificial Intelligence Laboratory, Massachusetts Institute
of Technology,
200 Technology Square, Room 434, Cambridge MA 02139
![]() NASA Ames Research Center, Moffett Field, CA 94035
NASA Ames Research Center, Moffett Field, CA 94035
Each cell in an organism contains an identical copy of the full set of genetic material for that organism, yet a brain cell is very different from a kidney cell. The vast difference in different cell varieties in a multicellular organism are due solely to differences of gene expression: some of the genes are turned on in every cell, while others are turned on only in cells of a given type. Other genes are designed to turn on and off throughout the life of the cell, and do this in response to specific internal signals or external stimuli. Most genes in a cell are probably turned off most or all of the time. Through modulation of the genetic ``switches" occurring at the transcriptional level, or further downstream at the translational level, the genetic program can also modulate the rates of many processes. For all of the above reasons it is wrong to view the genetic information as a mere list of proteins -- it is also a detailed program for how to use these proteins, when to start and stop their production, and which genes get turned on and off together. Initially in an embryo, the genetic program is exactly the same in every cell for the simple reason that there is at first only a single copy of the genes. As the cells in the embryo divide, more identical copies of the genes are made, but how does the cell ``know" where and when to switch different genes on and off? In this context what could possibly constitute a genetic blueprint for the developments of a complicated multicellular organism?
This is a fundamental problem in biology, the problem of cellular morphogenesis in the embryo. It is a problem that ultimately requires much more than a list of genes for its full solution. While insight into this problem may be applicable to many types of biological pattern formation, here we are particularly interested in the early stages of morphogenesis. This process is initiated by a cascade of gene switching events that occur, seemingly magically, at the right times and places within an embryo leading to the development of a complex multicellular organism. The principal problem in this case is the determination of a mechanism by which complex order may set in in an initially homogeneous system. That is, if the initial state of each cell (the set of active genes) and the laws of development (the genetic information in toto) are the same in every cell, how is the symmetry of the fertilized egg broken? How does the initial symmetry breaking occur within the rather constrained arena of the genetic regulatory processes and biochemistry of the cell? So far no one has provided a convincing answer to this important problem.
This question was partially addressed by Alan Turing in 1952 in his seminal paper on chemical morphogenesis (Turing, 1952) where he showed that a system of reacting and diffusing chemical species could spontaneously form stationary spatial patterns given a certain set of chemically plausible mechanisms. This requires that there be at least two reacting chemical species that diffuse at very different rates. The system is an intrinsically non-equilibrium one; both substances are continuously created (by the cells) at every point in space, and also decay or are removed at specified rates. The slow diffusing substance (the activator) is autocatalytic, meaning it participates in its own production. In another reaction some of the activator is transformed into the fast-diffusing substance (the inhibitor). Lastly the inhibitor causes the activator to be removed from the system at a rate proportional to the concentration of the inhibitor at that point in space. Thus in these reactions the activator makes more activator and inhibitor, and the inhibitor destroys the activator.
The Turing mechanism has often been put forward, as was Turing's original intent, as a model for certain aspects of morphogenesis (Meinhardt, 1982; Koch & Meinhardt, 1994; Kondo & Asai, 1995; Sawai et al., 2000) such as pre-patterning in the embryo. It has also served as a model for self-organization in more generic systems (Glansdorff & Prigogine, 1971). With the first verifiable observation of Turing pattern formation in a real chemical system (Castets, Dulos, Boissonade & De Kepper, 1990) the subject now finally has an experimental basis (Lengyel & Epstein, 1992). The specific model proposed by Turing is not the only possibility that will support pattern formation of the type Turing was specifically interested in. The two features of the reaction necessary for the formation of Turing patterns are short-range autocatalysis and long-range inhibition (Gierer & Meinhardt, 1972), and there are a number of ways this can be brought about. However, under most conditions it has been found that pattern formation can only occur when the diffusion rate of the inhibitor is significantly greater than that of the activator.
Therein lies, as is often noted by researchers familiar with real
biological mechanisms, a big problem: fairly small molecules usually
do the diffusing, but most small molecules diffuse at approximately
the same rates in aqueous solutions. Even molecules of substantially
different size will diffuse at fairly similar rates. (A
least-squares fit of the diffusion coefficients of 146 proteins in
Sober (1970) reveals that they scale roughly as
![]() .)
While some patterns can form in systems where the ratio of the
diffusion coefficients is greater than 2, in practice it has been
found that the diffusion rates usually need to be even more different
that this for stable and robust patterns to form. Not only is it
difficult to imagine molecules that have the appropriate properties,
it is also difficult to imagine how any kind of sensitive cellular
control of the pattern forming process can be achieved since it would
probably be nearly impossible for the cell to directly modulate
intrinsic properties like the diffusion rates of chemical
morphogens. These caveats have been more than enough to cause
some to seriously doubt the applicability of the Turing
mechanism to cellular patterning of any kind.
.)
While some patterns can form in systems where the ratio of the
diffusion coefficients is greater than 2, in practice it has been
found that the diffusion rates usually need to be even more different
that this for stable and robust patterns to form. Not only is it
difficult to imagine molecules that have the appropriate properties,
it is also difficult to imagine how any kind of sensitive cellular
control of the pattern forming process can be achieved since it would
probably be nearly impossible for the cell to directly modulate
intrinsic properties like the diffusion rates of chemical
morphogens. These caveats have been more than enough to cause
some to seriously doubt the applicability of the Turing
mechanism to cellular patterning of any kind.
Turing's original model is also completely linear. The original intent was to illustrate the onset of an instability leading to pattern formation. The model is not realistic in regard to the subsequent development of the pattern, since the patterns would have to be restablized far from equilibrium by nonlinearities not included in the original model. Even subsequent nonlinear studies have in most cases focused on mathematically interesting improvements rather than chemically or biologically realistic mechanisms. What is needed is a realistic model for pattern formation that is robustly able to produce patterns out of the basic biochemical machinery of the cell. Because of the above-mentioned problems it is not obvious how this is to be accomplished. In the past, most or all of the focus has been placed on reactional aspects, while the more difficult problems of the chemicals behind the reactions, and especially the biological mechanisms behind these reactions, have been largely ignored.
In this paper we aim to deal with these neglected aspects of the problem. We show that stationary, symmetry-breaking Turing-type patterns can form in physiologically realistic systems, even when the extracellular diffusion coefficients are equal. Strictly speaking then, these are not ``Turing" patterns since the mechanism is different. However ``Turing-type" patterns do occur for the same reasons as ``Turing" patterns. The physiologically realistic models we consider are ones that make use of the basic kinetic properties of the receiver and transmitter proteins responsible for signal transduction through the cell membrane. The proposed pattern-forming mechanism can not only explain pattern formation when the diffusion rates of the morphogens are very similar, but also shows how details of the mechanism might be sensitively controlled by the genetic machinery of the cell.
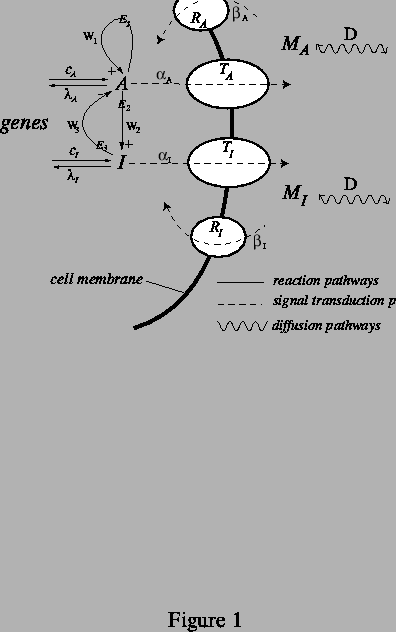
In the class of mechanisms we examine, schematized in Fig. 1, we make a sharp distinction between reactants, which participate in reactions inside the cell, and messenger molecules, which diffuse between cells. No transport of molecules across cell membranes takes place. Rather, signal transduction across the cell membrane, mediated by membrane proteins, connects the genetically controlled biochemical reactions in the cytosol to the production of messenger molecules that diffuse through the aqueous extracellular matrix. The messenger molecules diffuse outside the cells at approximately equal rates, coupling the reactions taking place inside cells at different points in space. Importantly, the cell essentially has nearly complete freedom to control the signal transduction kinetics, whose associated rates could quite easily vary by many orders of magnitude. This is to be strongly contrasted with the situation where the diffusion coefficients themselves are required to differ by a large amount -- the standard route to Turing patterns -- since it is difficult to imagine realistic situations where this holds true.
The specific model we use as an example below makes use of reactions and reaction kinetics of a type which can be found in every living cell. The chemical equations we use are derived from catalyzed chemical reactions. The genetic machinery of the cell controls the rates of these reactions by controlling the production of the catalysts. The chemical reactions and other properties incorporated in this class of models are rather generic, and similar results can be realized in many possible systems.
We purposely do not specify the details of this signal transduction
mechanism any more than is absolutely necessary, and virtually any
type of signal transduction kinetics will do. We will show that the
coupling via signal transduction between reactions occurring in cells
is enough to allow Turing-type patterns to spontaneously form in
collections of cells, even if the messenger diffusion rates (![]() ) are
identical or very similar in the aqueous extracellular environment.
Because of this we believe the mechanisms described here could be of
some relevance to understanding many aspects of cellular
morphogenesis.
) are
identical or very similar in the aqueous extracellular environment.
Because of this we believe the mechanisms described here could be of
some relevance to understanding many aspects of cellular
morphogenesis.
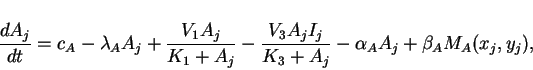
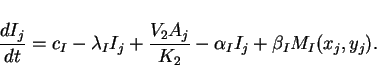
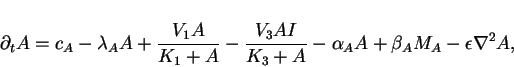
The simplified set of reactions taking place in the cytosol involves an
``activator" substance ![]() and an ``inhibitor" substance
and an ``inhibitor" substance ![]() that are
synthesized by the cell at the rates
that are
synthesized by the cell at the rates ![]() and
and ![]() respectively, and in
turn are broken down by the cell at the rates
respectively, and in
turn are broken down by the cell at the rates ![]() and
and ![]() as diagrammed in Fig. 1, where
as diagrammed in Fig. 1, where
![\begin{displaymath}
d[A]/dt = c_A-\lambda_A [A],\ \ \ \ d[I]/dt = c_I-\lambda_I [I].
\end{displaymath}](img55.gif) |
(1) |
![\begin{displaymath}
A+E_1\rightleftharpoons E_1A \ \ (K_1 = [E_1][A]/[E_1A]), \ ...
...ray}{c}
k_1 \\
\longrightarrow
\\
\
\end{array} E_1 A+ A ,
\end{displaymath}](img56.gif) |
(2) |
![\begin{displaymath}
d[A]/dt = {V_1 [A]/( K_1+[A])},\ \ \ V_1 = [E_1]_c k_1, \end{displaymath}](img57.gif)
![\begin{displaymath}
A+E_2\rightleftharpoons E_2A \ \ (K_2 = [E_2][A]/[E_2A]), \ ...
...ray}{c}
k_2 \\
\longrightarrow
\\
\
\end{array} E_2 A+ I ,
\end{displaymath}](img59.gif) |
(3) |
![\begin{displaymath}
d[I]/dt \simeq {V_2 [A]/ K_2},\ \ \ V_2 = [E_2]_c k_2, \end{displaymath}](img60.gif)
![\begin{displaymath}
A+E_3\rightleftharpoons E_3A \ \ \ \ (K_3 = [E_3][A]/[E_3A]),\end{displaymath}](img62.gif) |
(4) |
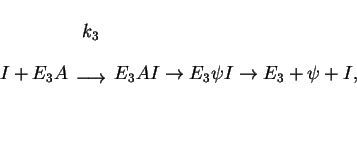
![\begin{displaymath}
-d[A]/dt = {V_3 [A][I]/( K_3+[A])},\ \ \ V_3 = [E_3]_c k_3. \end{displaymath}](img64.gif)
In addition to being biologically reasonable, our model differs from
the classical Turing model in two important respects. First, it takes
into account the fact that genetically regulated biochemical processes
will take place inside the cell, while cell-to-cell interaction must
involve some form of trans-membrane signaling, since most biomolecules
are highly insoluble in the lipid matrix of the cell
membrane. Secondly, the diffusion of the two messenger molecules
through the extracellular matrix can take place at identical rates
![]() .
.
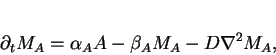
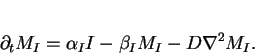
Since pre-patterning is likely to involve switching on different sets
of genes in different cells, some mechanisms must exist for signaling
between the genes. Our model makes use of signal transduction kinetics
diagrammed in Fig. 1, where ![]() and
and ![]() are the rates of
production of the messenger molecules
are the rates of
production of the messenger molecules ![]() and
and ![]() . This process
is mediated by transmitter proteins
. This process
is mediated by transmitter proteins ![]() and
and ![]() in the
membrane. In the figure, signal transduction is viewed as the
transformation of
in the
membrane. In the figure, signal transduction is viewed as the
transformation of ![]() and
and ![]() into
into ![]() and
and ![]() respectively
(though transformation into messenger molecules is not a requirement
of the model). Conversely, the
respectively
(though transformation into messenger molecules is not a requirement
of the model). Conversely, the ![]() and
and ![]() are the rates
of transformation of
are the rates
of transformation of ![]() and
and ![]() into
into ![]() and
and ![]() , a process
mediated by
, a process
mediated by ![]() and
and ![]() , the receiver proteins. Since the
basic features responsible for the self-organization of the system are
generic, this simplified picture can stand for more complex signal
transduction mechanisms. For example, the signal transduction could
involve the binding of
, the receiver proteins. Since the
basic features responsible for the self-organization of the system are
generic, this simplified picture can stand for more complex signal
transduction mechanisms. For example, the signal transduction could
involve the binding of ![]() or
or ![]() to specific receptor proteins on the
intracellular side of the membrane, triggering the release of
messenger molecules on the extracellular side of the membrane which
then carry the signal to other cells.
to specific receptor proteins on the
intracellular side of the membrane, triggering the release of
messenger molecules on the extracellular side of the membrane which
then carry the signal to other cells.
One could view the coupling of the reactions occurring within cells as a process analogous to diffusion. Viewed in this general way, it relies on the same basic mechanism of short-range activation and long-range inhibition as Turing patterns. However, we stress that the pattern formation is not enabled by differing rates of diffusion in the true sense. Another important distinction is that in our model the parameters that control pattern formation are determined by the rates of production of the proteins that serve as the catlysts inside the cell. As a result it is clear how, in this case, pattern formation could be be switched on and off or from one mode to another by the genetic machinery, possibly on the scale of minutes.
The biological mechanism we propose here is analogous to the mechanism proposed as an explanation for the chlorite-iodide-malonic acid-starch reaction system, which was the first chemical system in which Turing patterns were observed experimentally (Castets, Dulos, Boissonade & De Kepper, 1990). Lengyel and Epstein (Lengyel & Epstein, 1991; 1992) showed that the existence of Turing patterns in this system, despite the similar diffusion coefficients of the reactants, is a consequence of the binding and unbinding of iodine to starch molecules that have been immobilized by the gel which serves as an ``inert" medium of the reaction. What we are proposing here is a biologically realistic and necessary mechanism that is able to provide just this type of effect in living cells. In this analogy, the role of the starch is played by the cell membrane.
Since cells are discrete, we consider the case where reactions take
place at discrete locations, but where the extracellular matrix in
which cell-to-cell diffusion takes place is continuous. Taking an
array of cells, where ![]() and
and ![]() represent the concentrations
represent the concentrations
![]() and
and ![]() of activator and inhibitor in the cell at location
of activator and inhibitor in the cell at location
![]() , we have the ordinary differential equations
, we have the ordinary differential equations
 |
(5) |
 |
(6) |
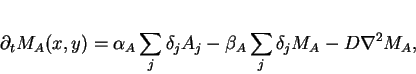
In the extracellular matrix, each cell is a point source and sink
(represented with delta functions). Letting
![]() and
and
![]() be the concentrations of messenger molecules
at position
be the concentrations of messenger molecules
at position ![]() , we have:
, we have:
 |
(7) |
 |
(8) |
where
![]() is equal
to
is equal
to ![]() when
when ![]() and
and ![]() and
and ![]() otherwise.
otherwise.
Fig. 2 shows a simulation using arrays of individual cells in one and two dimensions, demonstrating patterns in which the pattern wavelength is close to the size of a cell.
We now consider a fully continuous version in order to examine the analytic structure of the stability of the model.
Setting
![]() ,
,
![]()
![]() and
and
![]() to be the concentration at a given time
to be the concentration at a given time ![]() and
position
and
position ![]() , we can derive the following set of four
reaction-diffusion equations
, we can derive the following set of four
reaction-diffusion equations
 |
(9) |
 |
(10) |
 |
(11) |
 |
(12) |
For the purposes of keeping our illustration as simple as possible we will
specifically consider only the case where ![]() ,
,
![]() and
and
![]() . We further set limiting velocities
of the catalyzed reactions to
. We further set limiting velocities
of the catalyzed reactions to ![]() ,
, ![]() , and
, and ![]() , and
the parameters
, and
the parameters
![]() ,
, ![]() ,
, ![]() ,
, ![]() ,
and
,
and ![]() . For this model
the stationary homogeneous state is
. For this model
the stationary homogeneous state is
![]() and
and
![]() .
A standard linear stability analysis (Meinhardt, 1982) of Eqs. (1-4) about this state
tells us that an initial perturbation of the uniform state with a given
wave vector
.
A standard linear stability analysis (Meinhardt, 1982) of Eqs. (1-4) about this state
tells us that an initial perturbation of the uniform state with a given
wave vector ![]() will have an amplitude that grows (or shrinks) in
proportion to the factor
will have an amplitude that grows (or shrinks) in
proportion to the factor
![]() , where
, where ![]() are
eigenvalues of the stability matrix
are
eigenvalues of the stability matrix
![\begin{displaymath}
\tilde{\bf S }=
\left[\begin{array}{cccc}
3.55-\epsilon k^2-...
...-1-k^2 & 0 \\
0 & \rho & 0 &-\rho -k^2 \\
\end{array}\right],\end{displaymath}](img116.gif) |
(13) |
The type of patterns that form will depend to a large degree on the
spectrum of unstable ![]() modes; it especially depends on the mode with the
greatest
modes; it especially depends on the mode with the
greatest ![]() , but also on the range of other unstable modes.
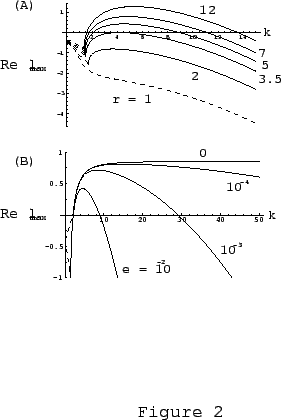
As was mentioned above, we included a small diffusion effect through
the membrane with diffusion coefficient
, but also on the range of other unstable modes.
As was mentioned above, we included a small diffusion effect through
the membrane with diffusion coefficient ![]() for mathematical reasons
in order to remove the singular nature of the equations when the diffusion
vanishes. In Fig. 3b we show the effect of varying
for mathematical reasons
in order to remove the singular nature of the equations when the diffusion
vanishes. In Fig. 3b we show the effect of varying ![]() on the
frequency spectrum. As
on the
frequency spectrum. As ![]() the spectrum of unstable modes is
broadened towards the higher frequency modes until at
the spectrum of unstable modes is
broadened towards the higher frequency modes until at ![]() , the
maximum
, the
maximum ![]() value in the spectrum goes to infinity. Physically this means
that shorter and shorter wavelengths will come to dominate, and at some
point the wavelength of the patterning will be limited by the finite
dimension of the cells.
value in the spectrum goes to infinity. Physically this means
that shorter and shorter wavelengths will come to dominate, and at some
point the wavelength of the patterning will be limited by the finite
dimension of the cells.
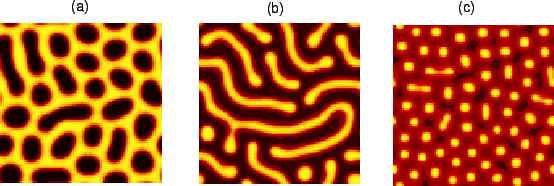
Fig. 4 shows patterns in a system in which the pattern wavelength is
larger than the size of a cell, simulated according to the
continuous model. The figure shows some of the ordered patterns that
emerge spontaneously in the system for varying values of
![]() . Patterns can range from (a) a ``honeycomb" pattern (
. Patterns can range from (a) a ``honeycomb" pattern (![]() ) to (b) stripes (
) to (b) stripes (![]() ) to (c) spots (
) to (c) spots (![]() ).
).
The proposed system is capable of supporting more or less the same patterns as an ordinary Turing mechanism that uses widely differing diffusion coefficients. The principal difference is that our mechanism provides a physiologically and chemically feasible route by which a wide range of patterns could arise.
Previous work has shown that pattern formation can occur in some systems with equal diffusion coefficients, but only if there is some kind of initial asymmetry such as a finite size perturbation (Vastano et al., 1987; Andresen et al., 1999; Henry & Wearne, 2002), an external advective flow (Rovinsky & Menzinger, 1992; 1993), or an already established gradient (Kerszberg & Wolpert 1998). These mechanisms might provide useful models for subsequent morphogenetic events in the embryo where some spatial genetic patterning or chemical gradients have already been set up, but still does not provide an adequate explanation of initial pre-patterning events which may start from a completely homogeneous initial state. The existence of an organizing center begs the question of how the center itself formed.
Our model provides a possible, physiologically realistic route to symmetry-breaking instabilities in cellular systems, and we hope that it will provide a useful context in which to explore the possible relevance of Turing mechanisms to cellular morphogenesis. For instance, our model makes a clear distinction between reacting and diffusing entities and thus provided somewhat different expectations for making experimental observations. The messengers could be almost any type of molecule, and are not required to have any complex reactive chemical properties. Rather, it is the properties of the transmitter and receiver proteins in the signal transduction pathway that will control the pattern formation. As a consequence it may be unproductive to search for specific ``morphogens" since the biochemical substances that differentiate spatial patterns in a collection of cells may be unrelated to the substances that actually mediate the cell-to-cell communication.
M.M. is supported by a Whitaker Foundation award. E.R. is supported by a National Science Foundation Graduate Fellowship.
References
ANDRESEN, P., BACHE, M., MOSEKILDE, E., DEWEL, G., & BORCKMANNS, P. (1999) Stationary space-periodic structures with equal diffusion coefficients. Phys. Rev. E 60, 297-301.
CASTETS, V., DULOS, E., BOISSONADE, J. & DE KEPPER, P. (1990) Experimental evidence of a sustained standing Turing-type nonequilibrium chemical pattern. Phys. Rev. Lett. 64, 2953-2956.
FERSHT, A. (1984) Enzyme Structure and Function (New York: W. H. Freeman).
GIERER, A. & MEINHARDT, H. (1972) A theory of biological pattern formation. Kybernetik 12, 30-39.
GLANSDORFF, P. & I. PRIGOGINE. (1971) Thermodynamics Theory of Structure, Stability and Fluctuations (London: John Wiley & Sons).
HENRY, B.I. & WEARNE, S.L. (2002) Existence of Turing instabilities in two-species fractional reaction-diffusion system. SIAM J. Appl. Math 62, 870-887.
KERSZBERG,M. & WOLPERT, L. (1998) Mechanisms for positional signaling by morphogen transport - a theoretical study. J. theor. Biol. 191, 103-114.
KNIGHT, T. & WEISS, R. (2000) Personal communication.
KOCH, A. J. & MEINHARDT, H. (1994) Biological Pattern Formation. Rev. Modern Phys. 66, 1481-1507.
KONDO, S. & ASAI., R. (1995) A reaction-diffusion wave on the skin of the marine angelfish Pomacanthus. Nature 376, 765-768.
LENGYEL, I. & EPSTEIN, I. R. (1991) Modeling of Turing structures in the chlorite-iodide-malonic acid-starch reaction system. Science 251, 650-652.
LENGYEL, I. & EPSTEIN, I. R. (1992) A chemical approach to designing Turing patterns in reaction-diffusion systems. Proc. Natl. Acad. Sci. 89, 3977-3979.
MEINHARDT, H. (1982) Models of Biological Pattern Formation (London: Academic Press).
ROVINSKY, A. B. & MENZINGER, M. (1992) Chemical Instability Induced by a Differential Flow. Phys. Rev. Lett. 69, 1193-1196.
ROVINSKY, A. B. & MENZINGER, M. (1993) Self-Organization Induced by the Differential Flow of Activator and Inhibitor. Phys. Rev. Lett. 70, 778-781.
SAWAI, S., MAEDA, Y, & SAWADA, Y. (2000) Spontaneous symmetry breaking turing-type pattern formation in a confined Dictyostelium cell mass. Phys. Rev. Lett. 85, 2212-2215.
SEGEL, L. A. & JACKSON, J. L. (1972) Dissipative structure: an explanation and an ecological example, J. Theor. Biol. 37, 545-459.
SOBER, H., ed. (1970) Handbook of biochemistry; Selected data for molecular biology (Cleveland: Chemical Rubber Co.).
TURING, A. M. (1952) The Chemical Basis of Morphogenesis. Phil. Trans. Royal Soc. B 237, 37-72.
VASTANO, J. A., PEARSON, J. E., HORSTHEMKE, W. & SWINNEY, H. L. (1987) Chemical Pattern Formation with Equal Diffusion Coefficients. Phys. Lett. A 124, 320-324.
|
|
|
|