

Figure 1: Percentage of female degree recipients for MIT S.B. degrees awarded during the 1992-93 academic year. Source: National Center for Educational Statistics, Integrated Postsecondary Education Data System Completions Survey, 1992-93.
Examining only the percentage of women, as in figure 1, ignores the variation in the total number of students in each area. To provide a clearer picture, figure 2 shows for 1993 the percentage of MIT S.B. degrees that were awarded in each area, with men and women shown separately. We see that, although EE has a relatively low ratio of women to men, EE was in fact one of the largest attractors of women: 12% of MIT women (42 of the 352 receiving degrees in 1993) obtained their degrees in EE. This was a larger number than any other area except Chemical Engineering.
One reason that the ratio (Figure 1) is so small is that EE is so much more attractive to men: 20% (147) of MIT men in 1993 received degrees in EE. To put it another way, a woman was only 2/3 as likely as a man to be receiving a degree in EE. Computer Science, which attracted 4% (15) of the women and 11% (82) of the men, shows a greater imbalance than EE: a woman was only 2/5 as likely as a man to be receiving a degree in CS. This is in striking contrast to, say, Chemical Engineering, which attracted 12% (51) of the women and 4% (32) of the men, making a woman 3 1/2 times as likely as a man to be receiving a degree in Chem E.

Figure 2: Of the 352 women and the 748 men who received MIT S.B. degrees during the 1992-93 academic year, the chart shows what fraction of the men and women received degrees in each area. Source: National Center for Educational Statistics, Integrated Postsecondary Education Data System Completions Survey, 1992-93.
(degrees in field to women / total degrees to women) / (degrees in field to men / total degrees to men)
The difference between this ratio and 100% indicates the disparity in the rates at which men and women major in the field.
The following chart shows this ratio for degrees granted in 1993 and in 1991 (which we use below for comparison with other schools). We also compute the adjusted ratio at which men and women in the 1994 sophomore class chose to major in EECS, and the ratio at which current sophomores indicated an interest in majoring in EECS on their MIT application forms.[2] For degrees granted in 1991 and 1993, we show ratios in EE, in CS, and in EECS combined. For current sophomores we show only EECS combined.[3]
                1991  S.B.      1993  S.B.      1994  fall      1993
                degrees         degrees         sophomore       admissions
                granted         granted         majors          preference
                                                                for EECS
ratio for EE         .44             .61              --              --
ratio for CS         .75             .39              --              --
ratio for EECS       .55             .59             .46             .41
As the table shows, women at MIT are only about half as likely as men to major
in EECS. Also, from 1991 to 1993, women within the department apparently
shifted from CS to EE (the enrollment history in figure 5 confirms this). It's
also not clear what to make of the drop in ratio from 1993 degrees to 1994
sophomore enrollments.
The enrollment patterns were reasonably consistent over the three years. The most significant change was the large shift in women enrollment from biology to chemical engineering. In EECS, the overall percentage of men and women was stable (28% of men and 15% of women in 1991 versus 31% of men and 16% of women in 1993), although there was a notable shift in women from computer science to electrical engineering.
It's also interesting to remark that male enrollment is noticeably more "bunched" than female enrollment: 47% of MIT undergraduate men received degrees in the three most popular areas for men (EE, MechE, and CS), while 37% of the women received degrees in the three most popular areas for women (Chem E, EE, and Biology).
In addition, the data contradicts, for MIT, some of the hypotheses that are often put forward to explain why relatively fewer women than men major in EE and CS. It's common to observe that women are generally not as attracted engineering fields as are men. While this is true nationally (see figure 13 below), MIT students form a very distinct population. As shown in figure 1, the ratio of women to men in engineering is virtually the same as the ratio of women to men for all S.B. degrees--an MIT woman was just as likely as an MIT man to receive a degree in an engineering field.[4]
The data also discredits the view sometimes expressed that women, more than men, tend to avoid rigid programs in favor of programs with more electives. Chemical engineering, which attracts the relatively largest number of women, is also the program at MIT with the largest number of requirements and the fewest number of electives.

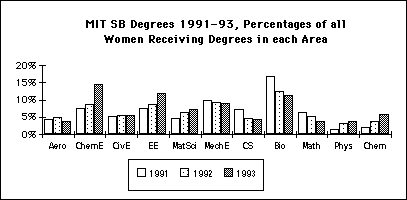
Figure 3: Percentages of male (top chart) and female (bottom chart) MIT S.B. degree recipients who received degrees in each area for the academic years 1990-91, 1991-92, and 1992-93. Total numbers of degree recipients were: 1991, 731 men and 376 women; 1992, 679 men and 360 women; 1993, 748 men and 352 women. Source: National Center for Educational Statistics, Integrated Postsecondary Education Data System Completions Surveys.
Figure 4 shows the total MIT undergraduate degrees granted in EE and CS for men and women from 1971-1993, and figure 5 shows separately the percentages of men and women receiving degrees in EE and CS over this same period.[5] As described in the Report of the ad hoc Committee on Undergraduate Enrollment in Course VI,[6] there was little correlation between the choices of men and women to major in Course 6 vs. other departments at MIT, but a strong correlation between the choices made by men and women for EE vs. CS since 1985. As noted above, the introduction of the 6-2 program will make it difficult to track the EE vs. CS distinction in the coming years.
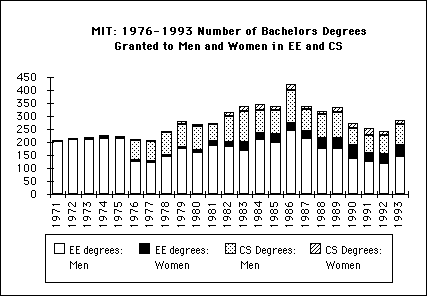
Figure 4: Number of MIT S.B. degrees granted to men and women over the period 1971-1993. Source: National Center for Educational Statistics, Integrated Postsecondary Education Data System Completions Surveys.

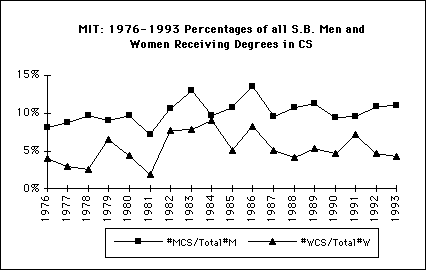
Figure 5: Percentages of MIT S.B. degrees granted to men and women each year in electrical engineering (top) and in computer science (bottom). Source: National Center for Educational Statistics, Integrated Postsecondary Education Data System Completions Surveys.
Figures 6, 7, and 8 show the fractions of men and women receiving 1991 bachelor's degrees in various area for CMU, RPI , and Georgia Tech--schools that, like MIT, have substantial undergraduate engineering enrollment. These should be compared with figures 2 and 3, which show analogous data for MIT.

Figure 6: Fraction of 1991 degrees awarded to men and women in various areas at Carnegie-Mellon University. The disparity between women and men in computer science was about the same as at MIT. In electrical engineering, only 3% of women received degrees in EE, as opposed to 14% of men--a disparity about twice as much as at MIT. Source: National Center for Educational Statistics, Integrated Postsecondary Education Data System Completions Surveys.
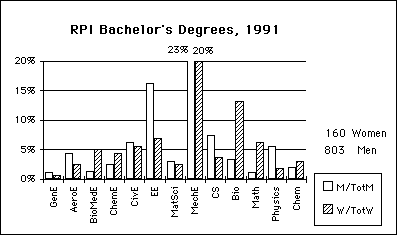
Figure 7: Fraction of 1991 degrees awarded to men and women in various areas at Rensselaer Polytechnic Institute. Disparity in rates at which men and women major in EE and CS is similar to MIT. Unlike MIT, the most attractive area for both men and women is Mechanical Engineering (these figures also include Industrial Engineering). Source: National Center for Educational Statistics, Integrated Postsecondary Education Data System Completions Surveys.
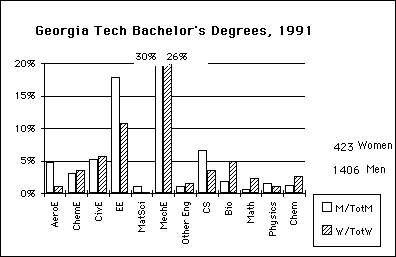
Figure 7: Fraction of 1991 degrees awarded to men and women in various areas at Georgia Institute of Technology. As at RPI, Mechanical (and Industrial) Engineering is the largest attractor fro both men and women. Disparity between men and women for EE and CS is similar to MIT. Source: National Center for Educational Statistics, Integrated Postsecondary Education Data System Completions Surveys.
Figures 8, 9, and 10 attempt to show comparisons across schools of the differential rates of male and female enrollment in engineering as a whole, in electrical engineering, and in computer science. In each figure, the top chart shows the percentage of all degrees awarded to men and women that were awarded in each area. The bottom chart shows the
adjusted ratio of women to men.[7]
For engineering overall (figure 8), it comes as no surprise that both men and women major in engineering at higher rates in the predominantly engineering schools than in the more broadly-based universities. More interesting is the fact that the disparity between the rates at which men and women major in engineering is also noticeably less at the engineering schools. Whatever general factors tend to disproportionately attract men toward engineering or disproportionately discourage women from engineering are considerably less of an issue at the predominantly engineering schools. For example, a woman receiving her degree at Stanford in 1991 was only 40% as likely as a man to be receiving it in an engineering field, while a woman at MIT in 1991 was 80% as likely as a man to be receiving it in engineering.
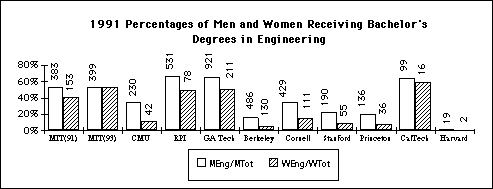
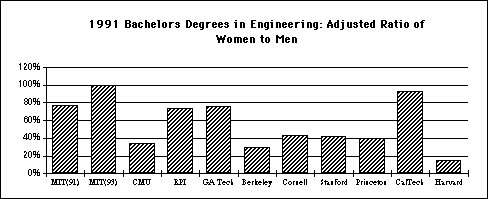
Figure 8: (Top) Percentages of all 1991 Bachelor's degrees that were awarded in engineering at selected schools, shown separately for men and for women. Numbers above each column show the number of men and women receiving degrees in engineering. For example, MIT granted 383 engineering degrees to men and 153 engineering degrees to women in 1991. For comparison the figure also shows MIT data for 1993. The MIT engineering numbers do not include Computer Science (6-3). (Bottom) Ratio of the percentage for women to the percentage for men. A ratio of 100% means that a man was just as likely as a woman to have received a degree in engineering. Source: National Center for Educational Statistics, Integrated Postsecondary Education Data System Completions Surveys.
Figure 9 shows the analogous ratios for degrees granted in electrical engineering. Of the schools shown here, only MIT, RPI, Georgia Tech and CalTech had more than 5% of women receiving degrees in EE. All schools except for CalTech showed significant disparity in the rate at which men were attracted to EE over women.[8] Schools with small EE departments had few women on a relative as well as an absolute scale: at Cornell 9 out of 751 women received degrees in EE, at Stanford 7 out of 601 women received degrees in EE.


Figure 9 (Top) Percentages of all 1991 Bachelor's degrees that were awarded in electrical engineering at selected schools, shown separately for men and for women. Numbers at the top of each column show the number of EE degrees granted to men and women. For example, MIT granted 129 degrees in EE to men and 29 degrees in EE to women in 1991. MIT data is shown both for 1991 and 1993. (Bottom) Ratio of the percentage for women to the percentage for men. A ratio of 100% means that a man was just as likely as a woman to have received a degree in electrical engineering. Source: National Center for Educational Statistics, Integrated Postsecondary Education Data System Completions Surveys.
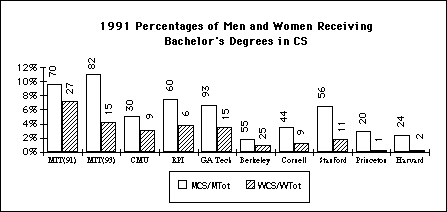

Figure 10: (Top) Percentages of all 1991 Bachelor's degrees that were awarded in computer science at selected schools, shown separately for men and for women. Numbers at the top of each column show the number of CS degrees granted to men and women. For example, MIT granted 170 degrees in CS to men and 27 degrees in CS to women in 1991. MIT data is shown both for 1991 and 1993. (Bottom) Ratio of the percentage for women to the percentage for men. A ratio of 100% means that a man was just as likely as a woman to have received a degree in computer science. Source: National Center for Educational Statistics, Integrated Postsecondary Education Data System Completions Surveys.
Figure 10 shows the analogous ratios for degrees granted in computer science. Despite figure 1's small ratio of men to women in MIT computer science--when compared with other departments at MIT--figure 10 shows that MIT is comparable to other selective schools, as measured both by the fraction of women receiving degrees in CS and by the smaller disparity in the rates at which women and men received degrees in CS. For some schools, the numbers of women majoring in CS are minuscule: of the 441 women graduating from Princeton in 1991, only 1 received a degree in CS; of the 725 women graduating from Harvard that year, only 2 received degrees in CS.
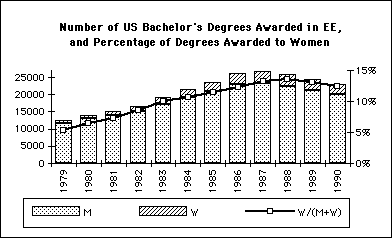
Figure 11: Numbers of US Bachelor's degrees in electrical engineering, and percentage of degrees awarded to women, 1979-1990. Source: US Dept. of Education, National Center for Educational Statistics, cited in Women and Minorities in Science and Engineering: an Update, National Science Foundation, NSF 92-303, 1992.
Figure 11 shows the number of degrees awarded nationally in electrical engineering from 1979 through 1990. The percentage of women graduating in EE has always been relatively low, and the numbers of both men and women, as well as the percentage of women, actually decreased somewhat from 1988 to 1990. Women received 14% of degrees in 1988, down to 12% in 1990.
Figure 12 shows the analogous data for computer science. Here, women account for a much higher percentage of degrees than in EE, but the decline in women enrollment since the mid 80s, both in absolute numbers and relative to men, has been much more pronounced. Women accounted for 37% of computer science bachelor's degrees in 1984 and 1985 but only 30% of degrees in 1990.[9]

Figure 12: Numbers of US Bachelor's degrees, and percentage of degrees awarded to women, 1979-1990. Source: US Dept. of Education, National Center for Educational Statistics. Source: US Dept. of Education, National Center for Educational Statistics, cited in Women and Minorities in Science and Engineering: an Update, National Science Foundation, NSF 92-303, 1992.
It's interesting to note that this downward trend in percentages of women in EE and CS is unlike the situation in some other areas in science and engineering, as shown in figure 13.

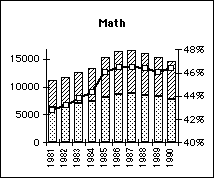
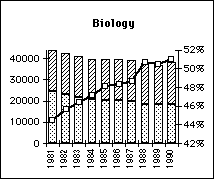


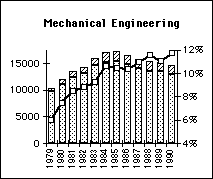
Figure 13: Numbers of US Bachelor's degrees granted to men and women, and percentages of degrees to women, for selected areas in science and engineering. Source: US Dept. of Education, National Center for Educational Statistics, cited in Women and Minorities in Science and Engineering: an Update, National Science Foundation, NSF 92-303, 1992.
It is also interesting to examine EECS preference as it relates to the decision to enroll at MIT.
   Men
               entering fall 93       entering fall 94
           admitted  enrolled   E/A    admitted  enrolled   E/A
intending    316       190      60%      298       178      60%
  EECS
intending    1024      520      51%      940       486      52%
  other
  Women
               entering fall 93       entering fall 94
           admitted  enrolled   E/A    admitted  enrolled   E/A
intending     73        39      53%       80        38      48%
  EECS
intending    714       329      46%      833       395      47%
  other
As the table shows, MIT's yield (fraction of admitted students who choose to
attend MIT) is higher than average among students intending to major in EECS.
It is disconcerting that this was not true for women in 1994.This suggests that a productive approach to equalizing the gender balance in EECS undergraduate enrollment would be to attempt some active recruiting to increase the admissions yield among women with EECS interests.
It is difficult to make the case that the low ratio of women to men is the result of factors unique to MIT. MIT does about as well as other selective engineering schools, and better than selective non-engineering schools, in the rates at which women major both in electrical engineering and in computer science relative to men. Also, EECS is a net "draw" for both men and women between their admission to MIT and their choice of a major, and the percentage of increase is about the same for men as for women.
Nevertheless, the committee believes that maintaining national leadership in EECS education requires more than merely doing somewhat less badly then comparable schools. We might improve the gender balance in EECS by attempting to increase the yield ratio of admitted women students with EECS interests. Beyond that, chapter 2 attempts to identify factors internal to MIT whose change might improve the situation.