Significant Events : 8263
Insignificant Events: 2065
Filtered Events : 4
Total positive sequences: 8263
| K-mer | Cluster | Offset | Pos Hit | Neg Hit | HGP |
|---|---|---|---|---|---|
| ---AACAAAGG | 0 | -4 | 837 | 32 | -213.6 |
| ---AACAATAG | 0 | -4 | 625 | 19 | -164.2 |
| ---AACAATGG | 0 | -4 | 585 | 20 | -150.8 |
| --GAACAAAG | 0 | -5 | 595 | 38 | -134.7 |
| ----ACAATAGA | 0 | -3 | 514 | 16 | -134.3 |
| ----ACAAAGGA | 0 | -3 | 571 | 36 | -129.7 |
| -AGAACAAT | 0 | -6 | 529 | 24 | -129.5 |
| ---AACAAAAG | 0 | -4 | 588 | 54 | -118.9 |
| --GAACAATA | 0 | -5 | 440 | 15 | -113.2 |
| ----ACAATGGG | 0 | -3 | 437 | 18 | -108.8 |
| --AAACAAAG | 0 | -5 | 540 | 50 | -108.8 |
| ----ACAATGGC | 0 | -3 | 427 | 16 | -108.2 |
| --GAACAATG | 0 | -5 | 445 | 21 | -107.9 |
| CAGAACAA | 0 | -7 | 435 | 23 | -102.9 |
| ----ACAAAGGG | 0 | -3 | 421 | 20 | -101.9 |
| CATAACAA | 0 | -7 | 382 | 11 | -100.8 |
| -AGAACAAA | 0 | -6 | 490 | 46 | -98.1 |
| ----ACAAAGGC | 0 | -3 | 432 | 32 | -93.5 |
| ---GACAAAGG | 0 | -4 | 411 | 26 | -93.0 |
| ---GACAATGG | 0 | -4 | 368 | 18 | -88.6 |
|
Explanation: On the top are the counts of binding events called by GEM (round_1) or GPS (round_2).
The line of "positive sequences" shows how many of the binding events are used for motif discovery. This number is limited by Next are the links to the k-mer set motif (KSM) file, k-mer alignment file, and PWM/PFM file.
Next 20 top ranking k-mers are listed in the table.
| |||||
| Motif PWM | Motif spatial distribution (w.r.t. primary PWM) |
|---|---|
 rc rcPWM: 7.91/13.02, hit=6483+/888-, hgp=1e-1841.8 | 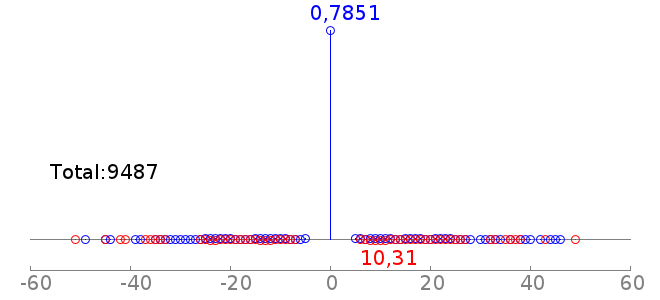 |
 rc rcPWM: 7.96/12.92, hit=1058+/364-, hgp=1e-85.7 | 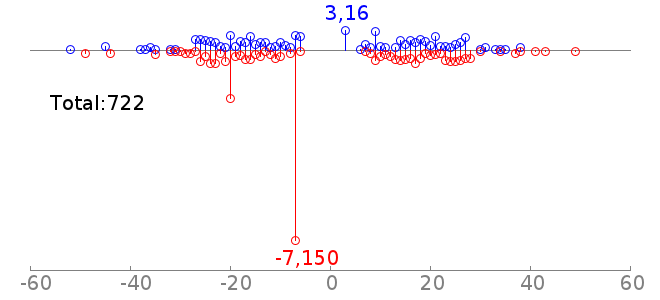 |
 rc rcPWM: 7.68/12.65, hit=467+/132-, hgp=1e-46.5 | 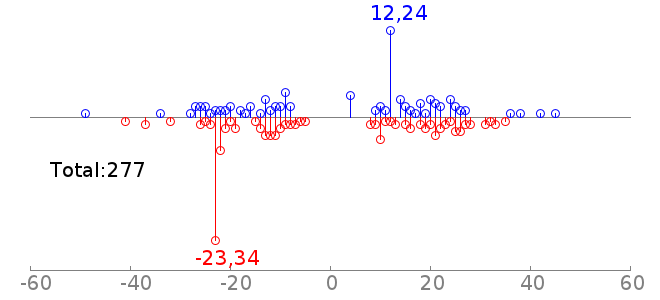 |
|
Explanation: First are the motifs in PWM format, each correspond to a k-mer set motif (KSM). Below the motif logo (clicking on rc gives the reverse compliment PWM logo) are:
Thus the second plot says, there are 722 cases of coocurrence of Sox2 and Oct4 motifs, and 150 of them are detected to have a motif offset of -7. This is consistent with the fact that Sox2 and Oct4 usually bind as heterodimer. Note: For the motif spatial distribution plot, GEM reports all the motif instances. There could be multiple motif instances on both strands. And the PWM hit is counting the sequences (at most one hit per sequence). Thus the total count in the motif spatial distribution plot may be larger than PWM hit. | |