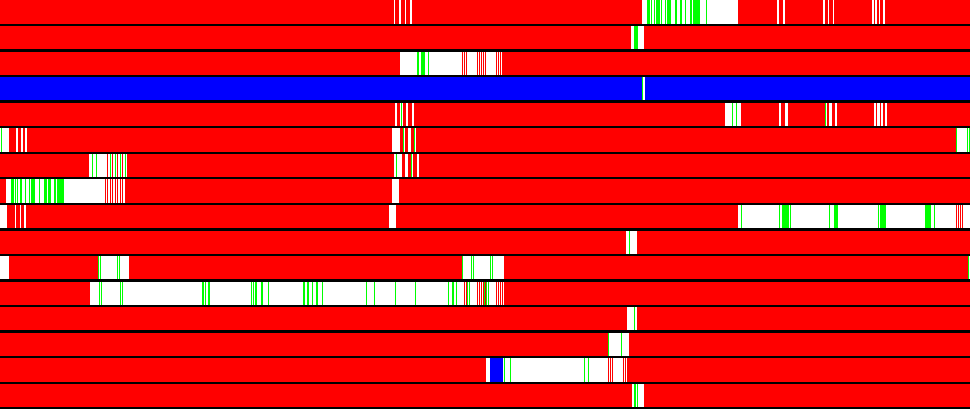
The trace shows which kind of operations each tile is performing for each time step over a few steady-state iterations of the benchmark. Optimal use of the RAW chip would have every used tile performing operations at all times. However, in most cases a time will arrive when the tile can no longer do useful work because of its interactions with other tiles. For sections colored white on the trace, the tile is able to execute its instructions with no stalls. Red shading means that the tile cannot continue execution until it has received data. Blue shading means that that particular tile has already filled its outgoing buffer and cannot continue generating new data until the destination tile consumes the data waiting to be sent. Green shading means that the processor is stalled waiting for resources or a bypass path that is not ready yet.
Notice that the shading only reflects the behaviour of the processor, and not the switch. It is possible that the processor could be trying to receive data from the switch while the switch is trying to send data; in this case the trace would be red because the processor is stalled waiting to receive data.